前言 一个服务要能支持高并发访问,一定要保证四层TCP/IP网络模型下所有层都支持高并发访问,但是由于虚拟化技术的出现,实际情况会更为复杂,本项目要调优的网络瓶颈细化后有如下要点
应用程序/进程本身支持高并发
运行进程的容器的网络配置支持高并发
管理容器的k8s Pod、管理集群网络的Service和k8s节点本身要支持高并发
宿主机的操作系统的网络配置要支持高并发
宿主机的硬件配置要支持高并发
测试环境说明 本地自测 可以使用本地环回网络自测,但是可能造成测试程序对本地待测试资源的抢占等
局域网组网测试 因为我的Linux主机是摆在我笔电旁边的物理机,因此我可以用网线直接组成以太网网络,不需要走延时和带宽不稳定的无线网络。
并且使用笔电运行测试程序,可以充分测试主机的网络能力
网卡带宽测试 测试以太网带宽和时延 这里使用笔电运行测试程序
1
2
3
4
5
6
7
8
9
10
11
12
13
14
15
16
17
18
19
20
21
22
Processing triggers for libc-bin (2.39-0ubuntu8.7) ... supdriver@TIANXUAN4:/mnt/e/download/iperf-3.21-win64$ iperf3 -c 192.168.50.2 Connecting to host 192.168.50.2, port 5201 [ 5] local 192.168.50.1 port 45291 connected to 192.168.50.2 port 5201 [ ID] Interval Transfer Bitrate Retr Cwnd [ 5] 0.00-1.04 sec 84.6 MBytes 681 Mbits/sec 172 556 KBytes [ 5] 1.04-2.08 sec 86.1 MBytes 696 Mbits/sec 0 660 KBytes [ 5] 2.08-3.08 sec 92.2 MBytes 776 Mbits/sec 0 758 KBytes [ 5] 3.08-4.02 sec 85.5 MBytes 764 Mbits/sec 0 841 KBytes [ 5] 4.02-5.05 sec 91.8 MBytes 747 Mbits/sec 2 682 KBytes [ 5] 5.05-6.06 sec 92.2 MBytes 761 Mbits/sec 17 559 KBytes [ 5] 6.06-7.08 sec 93.5 MBytes 774 Mbits/sec 0 673 KBytes [ 5] 7.08-8.08 sec 90.2 MBytes 757 Mbits/sec 0 771 KBytes [ 5] 8.08-9.08 sec 91.5 MBytes 768 Mbits/sec 0 851 KBytes [ 5] 9.08-10.08 sec 88.1 MBytes 736 Mbits/sec 0 930 KBytes - - - - - - - - - - - - - - - - - - - - - - - - - [ ID] Interval Transfer Bitrate Retr [ 5] 0.00-10.08 sec 897 MBytes 746 Mbits/sec 191 sender [ 5] 0.00-9.35 sec 895 MBytes 802 Mbits/sec receiver iperf Done. supdriver@TIANXUAN4:/mnt/e/download/iperf-3.21-win64$
可以看到带宽是千兆网卡级别的,时延是微秒级别的,对于本项目的高并发低带宽的使用场景来说绰绰有余
极简单接口QPS极限测试 我们用Go语言写一个理论QPS非常高的接口,然后去压测它,同时观测主机各个资源的消耗情况,试图找出瓶颈
无调优直接测 1 2 3 4 5 6 7 8 9 10 supdriver@m700:~/sup-iam$ wrk -t12 -c100 -d30s http://localhost:7070/healthz Running 30s test @ http://localhost:7070/healthz 12 threads and 100 connections Thread Stats Avg Stdev Max +/- Stdev Latency 5.20ms 7.75ms 105.74ms 88.38% Req/Sec 2.94k 1.18k 11.51k 72.83% 1052194 requests in 30.08s, 119.41MB read Requests/sec: 34978.94 Transfer/sec: 3.97MB supdriver@m700:~/sup-iam$
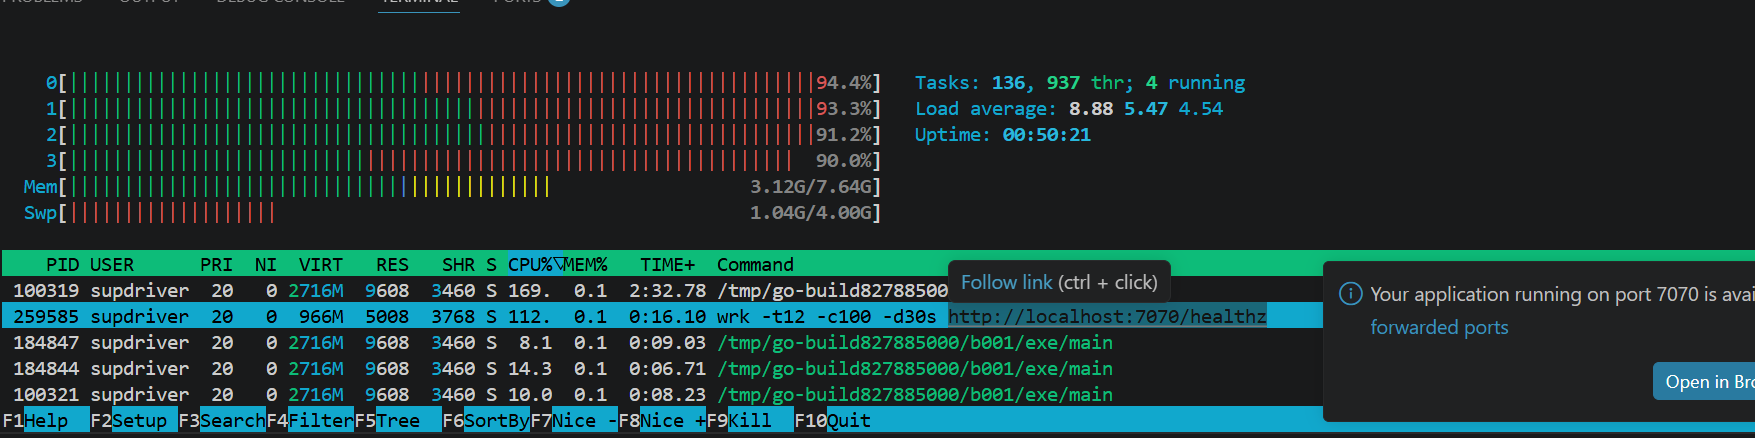
看一下运行时的CPU消耗
发现爆满了,再试试去笔电上运行压测程序
1 2 3 4 5 6 7 8 9 10 supdriver@TIANXUAN4:/mnt/c/Users/19049$ wrk -t12 -c100 -d30s http://192.168.50.2:7070/healthz Running 30s test @ http://192.168.50.2:7070/healthz 12 threads and 100 connections Thread Stats Avg Stdev Max +/- Stdev Latency 2.94ms 2.19ms 58.99ms 93.56% Req/Sec 2.96k 378.53 5.76k 73.19% 1063568 requests in 30.09s, 120.70MB read Requests/sec: 35343.45 Transfer/sec: 4.01MB supdriver@TIANXUAN4:/mnt/c/Users/19049$
结果是CPU没有爆满,但是QPS没有提升,也就是说CPU不是瓶颈
我们再看一下延时分布
1 2 3 4 5 6 7 8 9 10 11 12 13 14 15 16 17 18 19 20 21 22 23 supdriver@TIANXUAN4:/mnt/c/Users/19049$ wrk -t12 -c100 -d30s --latency http://192.168.50.2:7070/healthz Running 30s test @ http://192.168.50.2:7070/healthz 12 threads and 100 connections Thread Stats Avg Stdev Max +/- Stdev Latency 2.90ms 2.29ms 50.25ms 94.08% Req/Sec 3.03k 409.25 5.37k 77.38% Latency Distribution 50% 2.40ms 75% 2.83ms 90% 4.07ms 99% 13.09ms 1087236 requests in 30.10s, 123.39MB read Requests/sec: 36122.95 Transfer/sec: 4.10MB supdriver@TIANXUAN4:/mnt/c/Users/19049$ ping 192.168.50.2 PING 192.168.50.2 (192.168.50.2) 56(84) bytes of data. 64 bytes from 192.168.50.2: icmp_seq=1 ttl=64 time=2.10 ms 64 bytes from 192.168.50.2: icmp_seq=2 ttl=64 time=1.03 ms ^C --- 192.168.50.2 ping statistics --- 2 packets transmitted, 2 received, 0% packet loss, time 1001ms rtt min/avg/max/mdev = 1.025/1.564/2.103/0.539 ms supdriver@TIANXUAN4:/mnt/c/Users/19049$
更换网络框架 1 2 3 4 5 6 7 8 9 10 11 12 13 14 15 16 package mainimport ( "github.com/valyala/fasthttp" ) func main () requestHandler := func (ctx *fasthttp.RequestCtx) ctx.SetStatusCode(fasthttp.StatusOK) ctx.SetBodyString("ok\n" ) } fasthttp.ListenAndServe(":7070" , requestHandler) }
测试结果如下
1 2 3 4 5 6 7 8 9 10 11 12 13 14 15 16 17 18 supdriver@TIANXUAN4:/mnt/c/Users/19049$ wrk -t12 -c100 -d30s --latency htpp://192.168.50.2:7070 Running 30s test @ htpp://192.168.50.2:7070 12 threads and 100 connections Thread Stats Avg Stdev Max +/- Stdev Latency 2.82ms 1.47ms 65.19ms 91.50% Req/Sec 2.95k 328.35 3.78k 78.82% Latency Distribution 50% 2.53ms 75% 2.86ms 90% 3.92ms 99% 9.23ms 1062273 requests in 27.90s, 138.79MB read Socket errors: connect 0, read 0, write 0, timeout 96 Requests/sec: 38073.50 Transfer/sec: 4.97MB supdriver@TIANXUAN4:/mnt/c/Users/19049$ 略有提高,这系统调用的开销到底是我CPU主频太低了还是软件跟不上硬件,没能发挥硬件的全部性能
略有提高,经计算:在 1.56ms 的 RTT 下,一个 TCP 连接理论上每秒最多能完成:
1 1000ms / 1.56ms ≈ 641 次请求/秒
在100连接下理论上限是
而我们的实际QPS已经达到理论的60%了,考虑到实际RTT更大,我们可以考虑提高连接数
使用200甚至更高连接数 1 2 3 4 5 6 7 8 9 10 11 12 13 14 15 supdriver@TIANXUAN4:/mnt/c/Users/19049$ wrk -t12 -c200 -d30s --latency htpp://192.168.50.2:7070 Running 30s test @ htpp://192.168.50.2:7070 12 threads and 200 connections Thread Stats Avg Stdev Max +/- Stdev Latency 4.75ms 1.56ms 38.08ms 88.75% Req/Sec 3.41k 352.38 4.38k 77.21% Latency Distribution 50% 4.57ms 75% 5.08ms 90% 5.84ms 99% 11.59ms 1228892 requests in 27.07s, 160.56MB read Socket errors: connect 0, read 0, write 0, timeout 192 Requests/sec: 45389.75 Transfer/sec: 5.93MB
可以看到QPS达到了45k,
改用本地测试 1 2 3 4 5 6 7 8 9 10 11 12 13 14 15 supdriver@m700:~$ wrk -t12 -c200 -d30s --latency htpp://127.0.0.1:7070 Running 30s test @ htpp://127.0.0.1:7070 12 threads and 200 connections Thread Stats Avg Stdev Max +/- Stdev Latency 5.41ms 7.00ms 124.30ms 88.29% Req/Sec 4.25k 1.39k 11.21k 69.23% Latency Distribution 50% 3.04ms 75% 7.27ms 90% 13.55ms 99% 33.21ms 1520028 requests in 30.09s, 198.60MB read Requests/sec: 50516.52 Transfer/sec: 6.60MB supdriver@m700:~$
可以看到QPS达到了50K,但是TTL已经很高了,说明网络系统已经不堪重负了,毕竟wrk还是很吃资源的
小结 考虑到实际应用场景至少也是要走以太网的,本地测试的参考性不足,取45KQPS作为本机的性能上限,确定性能瓶颈为TTL,其中系统调用的时延为TTL瓶颈,难以提升
k8s容器QPS瓶颈测试 我们来进入auth server的容器来测试一下
1 2 3 4 5 6 7 8 9 10 11 12 13 14 15 16 17 你搞错重点了,我在跟你讨论RTT的长尾时延问题,你再分析什么 root@iam-auth-server-5fccc9899b-cjfjm:/# wrk -t1 -c2 -d5s --latency http://127.0.0.1:7070/healthz Running 5s test @ http://127.0.0.1:7070/healthz 1 threads and 2 connections Thread Stats Avg Stdev Max +/- Stdev Latency 11.84ms 19.38ms 80.37ms 82.06% Req/Sec 3.60k 2.18k 8.57k 68.00% Latency Distribution 50% 258.00us 75% 18.94ms 90% 45.54ms 99% 69.71ms 18254 requests in 5.05s, 2.18MB read Requests/sec: 3616.49 Transfer/sec: 441.47KB root@iam-auth-server-5fccc9899b-cjfjm:/#
可以看到出现了十分验证的长尾时延 效应,推测可能是K8s CPU 节流(Cgroup throttling)导致的,再次运行时,我使用watch -n kubectl top pod来监控一下资源消耗,发现了中间CPU使用飙升至498m,逼近500m的限制,我们来放宽一下CPU限制到1024m看看,会不会有更好的表现
1 2 3 4 5 6 7 8 9 10 11 12 13 14 15 root@iam-auth-server-67b7dbd5db-l9fz5:/# wrk -t1 -c2 -d20s --latency http://127.0.0.1:7070/healthz Running 20s test @ http://127.0.0.1:7070/healthz 1 threads and 2 connections Thread Stats Avg Stdev Max +/- Stdev Latency 4.61ms 10.11ms 54.62ms 86.67% Req/Sec 9.39k 4.46k 17.21k 46.50% Latency Distribution 50% 121.00us 75% 0.99ms 90% 20.32ms 99% 43.06ms 187272 requests in 20.04s, 22.32MB read Requests/sec: 9343.09 Transfer/sec: 1.11MB root@iam-auth-server-67b7dbd5db-l9fz5:/#
可以看到提升显著,已经达到9k的QPS了
下面再提升一下测一下
1 2 3 4 5 6 7 8 9 10 11 12 13 14 15 root@iam-auth-server-66445b674b-w54d9:/# wrk -t1 -c2 -d20s --latency http://127.0.0.1:7070/healthz Running 20s test @ http://127.0.0.1:7070/healthz 1 threads and 2 connections Thread Stats Avg Stdev Max +/- Stdev Latency 318.82us 1.28ms 22.43ms 96.07% Req/Sec 20.94k 4.43k 27.87k 71.50% Latency Distribution 50% 75.00us 75% 95.00us 90% 184.00us 99% 7.74ms 416705 requests in 20.01s, 49.68MB read Requests/sec: 20829.28 Transfer/sec: 2.48MB root@iam-auth-server-66445b674b-w54d9:/#
可以看到达到20k的 QPS了,同时CPU的走远最高只到1670m,而且长尾时延没有过于严重,考虑到wrk本身就会消耗CPU资源,我们转到宿主机再测一下
1 2 3 4 5 6 7 8 9 10 11 12 13 14 15 supdriver@m700:~$ wrk -t1 -c2 -d20s --latency http://127.0.0.1:30070/healthz Running 20s test @ http://127.0.0.1:30070/healthz 1 threads and 2 connections Thread Stats Avg Stdev Max +/- Stdev Latency 206.95us 607.14us 13.20ms 96.12% Req/Sec 17.48k 4.52k 24.01k 61.00% Latency Distribution 50% 87.00us 75% 116.00us 90% 201.00us 99% 3.30ms 347938 requests in 20.01s, 41.48MB read Requests/sec: 17390.63 Transfer/sec: 2.07MB supdriver@m700:~$
可以看到还是有17k的QPS,而且长尾时延的问题更轻了。